Data Analyses
Data collection: field work
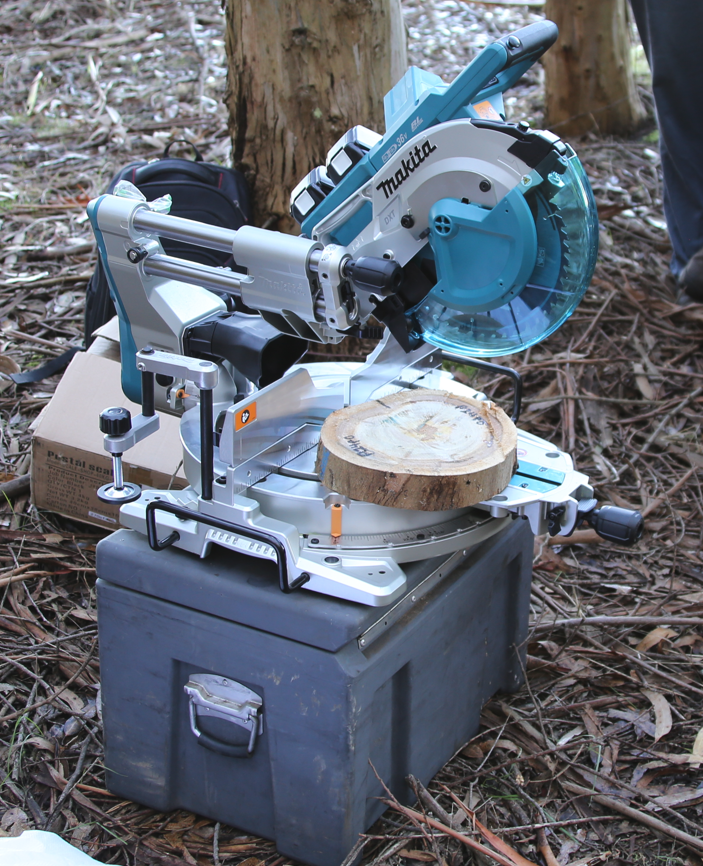
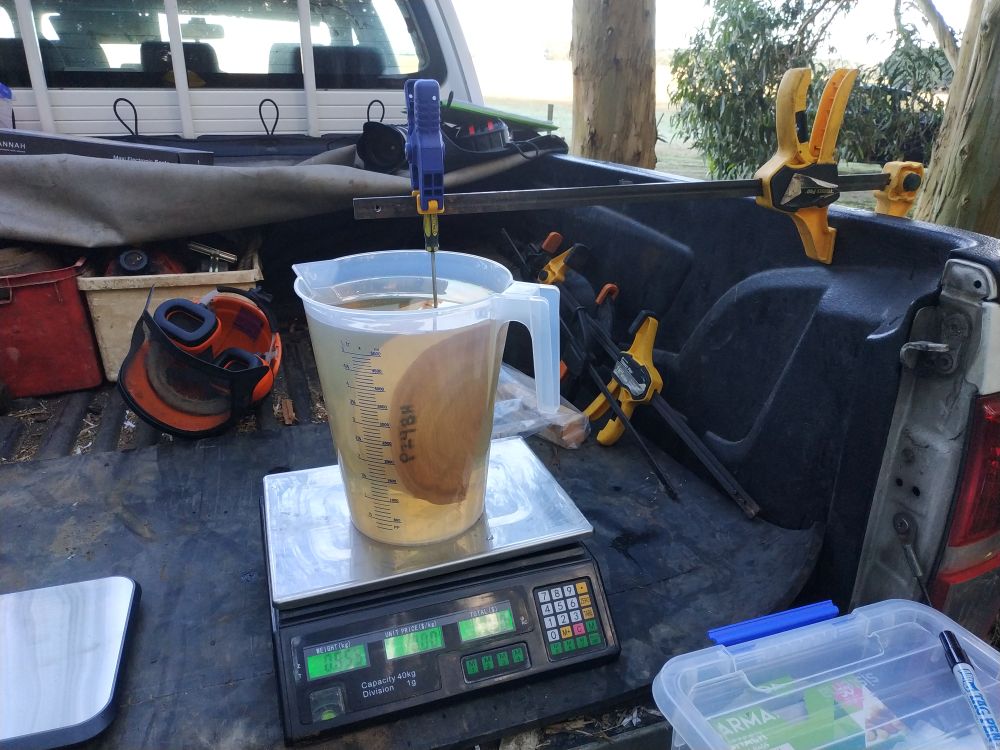
Field work is expensive and consequently needs to be well planned and targeted. Typically in R&D applications every study has different requirements and objectives, and so a clear written plan stating the objectives and purposes of the study is needed. This should include clear, step-by-step instructions for measurements which need to be collected in the field, such as green dry weight and volumes for the calculation of green density. Where possible any measurements that can be done in the office or laboratory should be done there, where measurement control, efficiency and comfort (discomfort increases the chances of errors and accidents) are typically greater.
With respect to in-field wood property measurement and methodology, FQ can advise in the preparation of targeted work plans. We can also undertake or contribute to the actual in-field sampling.
Data processing
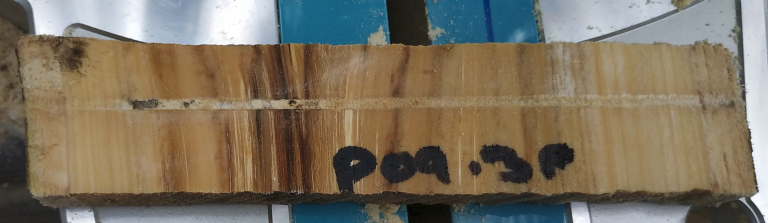
Data checking and prperation as a critical part of any analysis. Clear sample labelling, record keeping and data collation are essential. With respect to resi sampling, our web platform for processing data (e.g. https://forestquality.shinyapps.io/FQResi/) is designed to facilitate this. Each Resi trace has a unique filename, associated with a Tree ID entered by the user. There is also a comment field associated with each trace which can be used to record any features unique to that trace (this has to be filled out on the PD instrument prior to sampling).
FQ utilises the R programming language [1] for data checking and analyses.
Analysis and reporting
We can undertake the analysis and reporting of wood property data collected either by us or others, utilising our experience with data analysis and the broader literature. An example of a report produced is:!Example Report
Typically we would analyse data and prepare reports using Rmarkdown [2]or Quarto within the Rstudio environment [3]. In this way data preparation, analyses and reporting is recorded and transparent.